Only one hundred years ago, obtaining food required significant effort. People grew crops, raised livestock, or ventured out to catch fish, often relying on local ranchers and farmers for their meat and produce. In contrast, today, most people have no idea where their food is grown or raised. The food industry has changed dramatically since the Industrial Revolution. Incorporating machines in agriculture significantly increased the efficiency of food production processes. This, combined with scientific discoveries and new technology, catapulted the world's food systems into their unique, tumultuous state today. Refrigerators and freezers, for example, revolutionized how we store food and our relationship with it. As food preservation became easier, consumer behavior began to shift.
Now, with just a few taps on a phone or computer, it’s possible for someone to summon the meal of their choice to their doorstep within minutes. To make things even more convenient, disposable plastic cups, bags, and food packaging relieve you from the need to wash any dishes. Who doesn't love getting out of chores? The convenience is undeniable, as is the waste and pollution it generates. Food containers, ranging from styrofoam and cardboard to various types of plastics, have a significant impact on the environment.
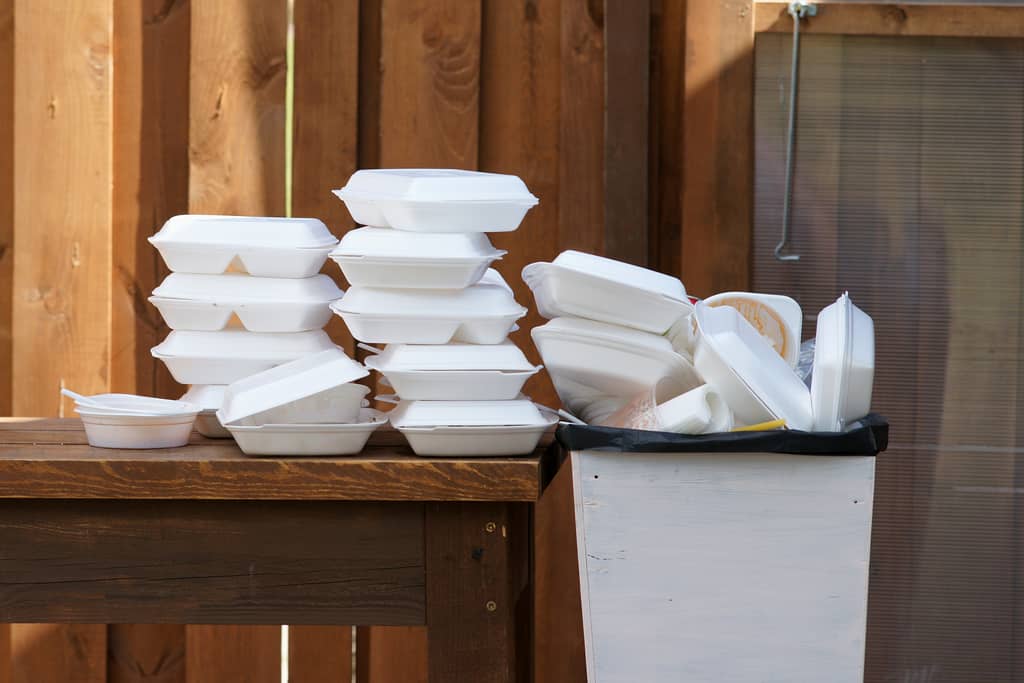
Styrofoam: Styrofoam, also known as expanded polystyrene, is infamous for its environmental impact due to its non-biodegradable nature. It can persist in landfills for hundreds of years, slowly breaking down into smaller pieces while releasing harmful chemicals. These chemicals can leach into the soil and groundwater, posing risks to ecosystems and human health. Despite its widespread use in packaging and insulation, Styrofoam's environmental footprint has led to increased efforts to find and adopt more sustainable alternatives.
Plastics: Plastics, particularly single-use varieties, are among the most significant environmental threats due to their extensive use and poor recyclability. Items like plastic bags, straws, and bottles are convenient but often end up in landfills or oceans, where decomposing takes centuries. The accumulation of plastic waste leads to pollution that harms wildlife and disrupts natural habitats. Efforts to reduce plastic use and improve recycling rates are crucial in mitigating the adverse environmental impacts of plastic waste.
Cardboard: Cardboard, though biodegradable, often becomes an environmental problem due to inefficient recycling practices. Many cardboard products end up in landfills, where they decompose and release methane, a potent greenhouse gas. This waste represents a significant loss of valuable resources, as cardboard can be recycled multiple times. Improving recycling systems and encouraging proper disposal is key to maximizing the environmental benefits of cardboard as a sustainable material.
Biodegradable Packaging: Biodegradable packaging made from plant-based materials offers a promising solution to the environmental issues posed by traditional packaging. These materials, derived from corn starch, sugarcane, and cellulose, can break down naturally without leaving harmful residues. Biodegradable packaging reduces the burden on landfills and lowers the risk of pollution, contributing to a more sustainable cycle of use and disposal.
Reusable Containers: Reusable containers like glass or stainless steel provide a sustainable alternative to single-use packaging. These materials are durable, easy to clean, and can be used repeatedly, reducing the overall consumption of disposable items. By adopting reusable containers, individuals and businesses can significantly reduce their environmental footprint, conserving resources and minimizing waste.
How often do we opt for pre-packaged convenience without considering the environmental consequences? By evaluating our purchasing decisions, we can make more sustainable choices. By embracing these alternatives, consumers can significantly reduce their ecological footprint. However, addressing the issue of food container waste requires more than just choosing the right materials.
Consumers need to change their perspective on food. Prioritizing convenience over sustainability must become a thing of the past. We can lessen our environmental footprint by making conscious choices and embracing sustainable alternatives. Remember, every small change adds up, and collectively, we can work towards a greener, more sustainable future.
Discover how you can make a difference in conserving energy and protecting our environment by checking out the energy activities on the Watt Watchers of Texas website! Dive into interactive and educational activities designed to teach you practical ways to save energy at home, school, and in your community. Join the movement towards a more sustainable future and become a Watt Watcher today. Visit Watt Watchers of Texas and start your energy-saving journey now!
Grade Level: 7, 8 Theme: Food, Materials Activity Overview: How often do you eat pre-packaged food? Some of the containers for pre-packaged food are made of plastic that cannot be recycled and only end up in a landfill. So what can you do to reduce your plastic waste? Think about what you buy. Does the food you buy come in non-recyclable plastic? Ask yourself if you could get the same food without wasting plastic. For example, instead of buying individually wrapped frozen food, you could make a bulk meal and store it in reusable individual containers.Buy in bulk. Can the food you buy in pre-packaged containers be bought in bulk and stored in reusable containers?There are real, easy ways to reduce the waste that you generate on a daily basis. Plastic takes energy to create and to dispose of. When you are intentional about how to reduce your waste, it helps you to reduce energy as well. Procedure As a class or in small groups, make a list of foods that come in lots of packaging (outside box, inside bag, individual wrappers, lids and bases, etc.). Then brainstorm ways to reduce landfill-destined packaging either by switching the food itself or by changing the packaging. Encourage creativity with these ideas. Even if the idea is unfeasible or still requires packaging, thinking through packaging in the food sector is an important step in reducing overall energy consumption and waste.For example, one can purchase yogurt at the grocery store in a cup with a lid in a multipack of many tethered together in another box or wrapper. Alternatively, one can make a batch of yogurt at home or purchase a large store-bought container of yogurt. This can create multiple single-servings of yogurt in bowls at home or portioned into school lunches by dividing into smaller plastic or glass containers that can be washed and reused. TEKS SCI.6.1B, SCI.7.1B, SCI.8.1B |
We'd love to help answer any questions and help you get started! Drop us a line and we'll get back to you as soon as we can.
Watt Watchers of Texas
204 E. Dean Keeton Street, Austin, Texas 78712
contact@watt-watchers.com
Nos encantaría contestarle cualquier pregunta que tenga y ayudarle empezar! Envíenos un mensaje y nos pondremos en contacto con usted lo antes posible.
Watt Watchers de Texas
204 E. Dean Keeton Street, Austin, Texas 78712
contact@watt-watchers.com