Activity Overview: Natural resources are not evenly distributed across the United States or even across the State of Texas. Looking at the horizon you can see if you are near the sea or surrounded by timber, but other resources crucial to our daily lives are less obvious. Each of the activities on this page references a different resource and provides resources your class can use to identify different sources of freshwater, fossil fuels, and renewable resources.
Time: This activity is part of a series on maps of natural resources. Each one takes about 15 minutes. You can schedule them in series or you can evaluate them as you discuss each resource in your class.
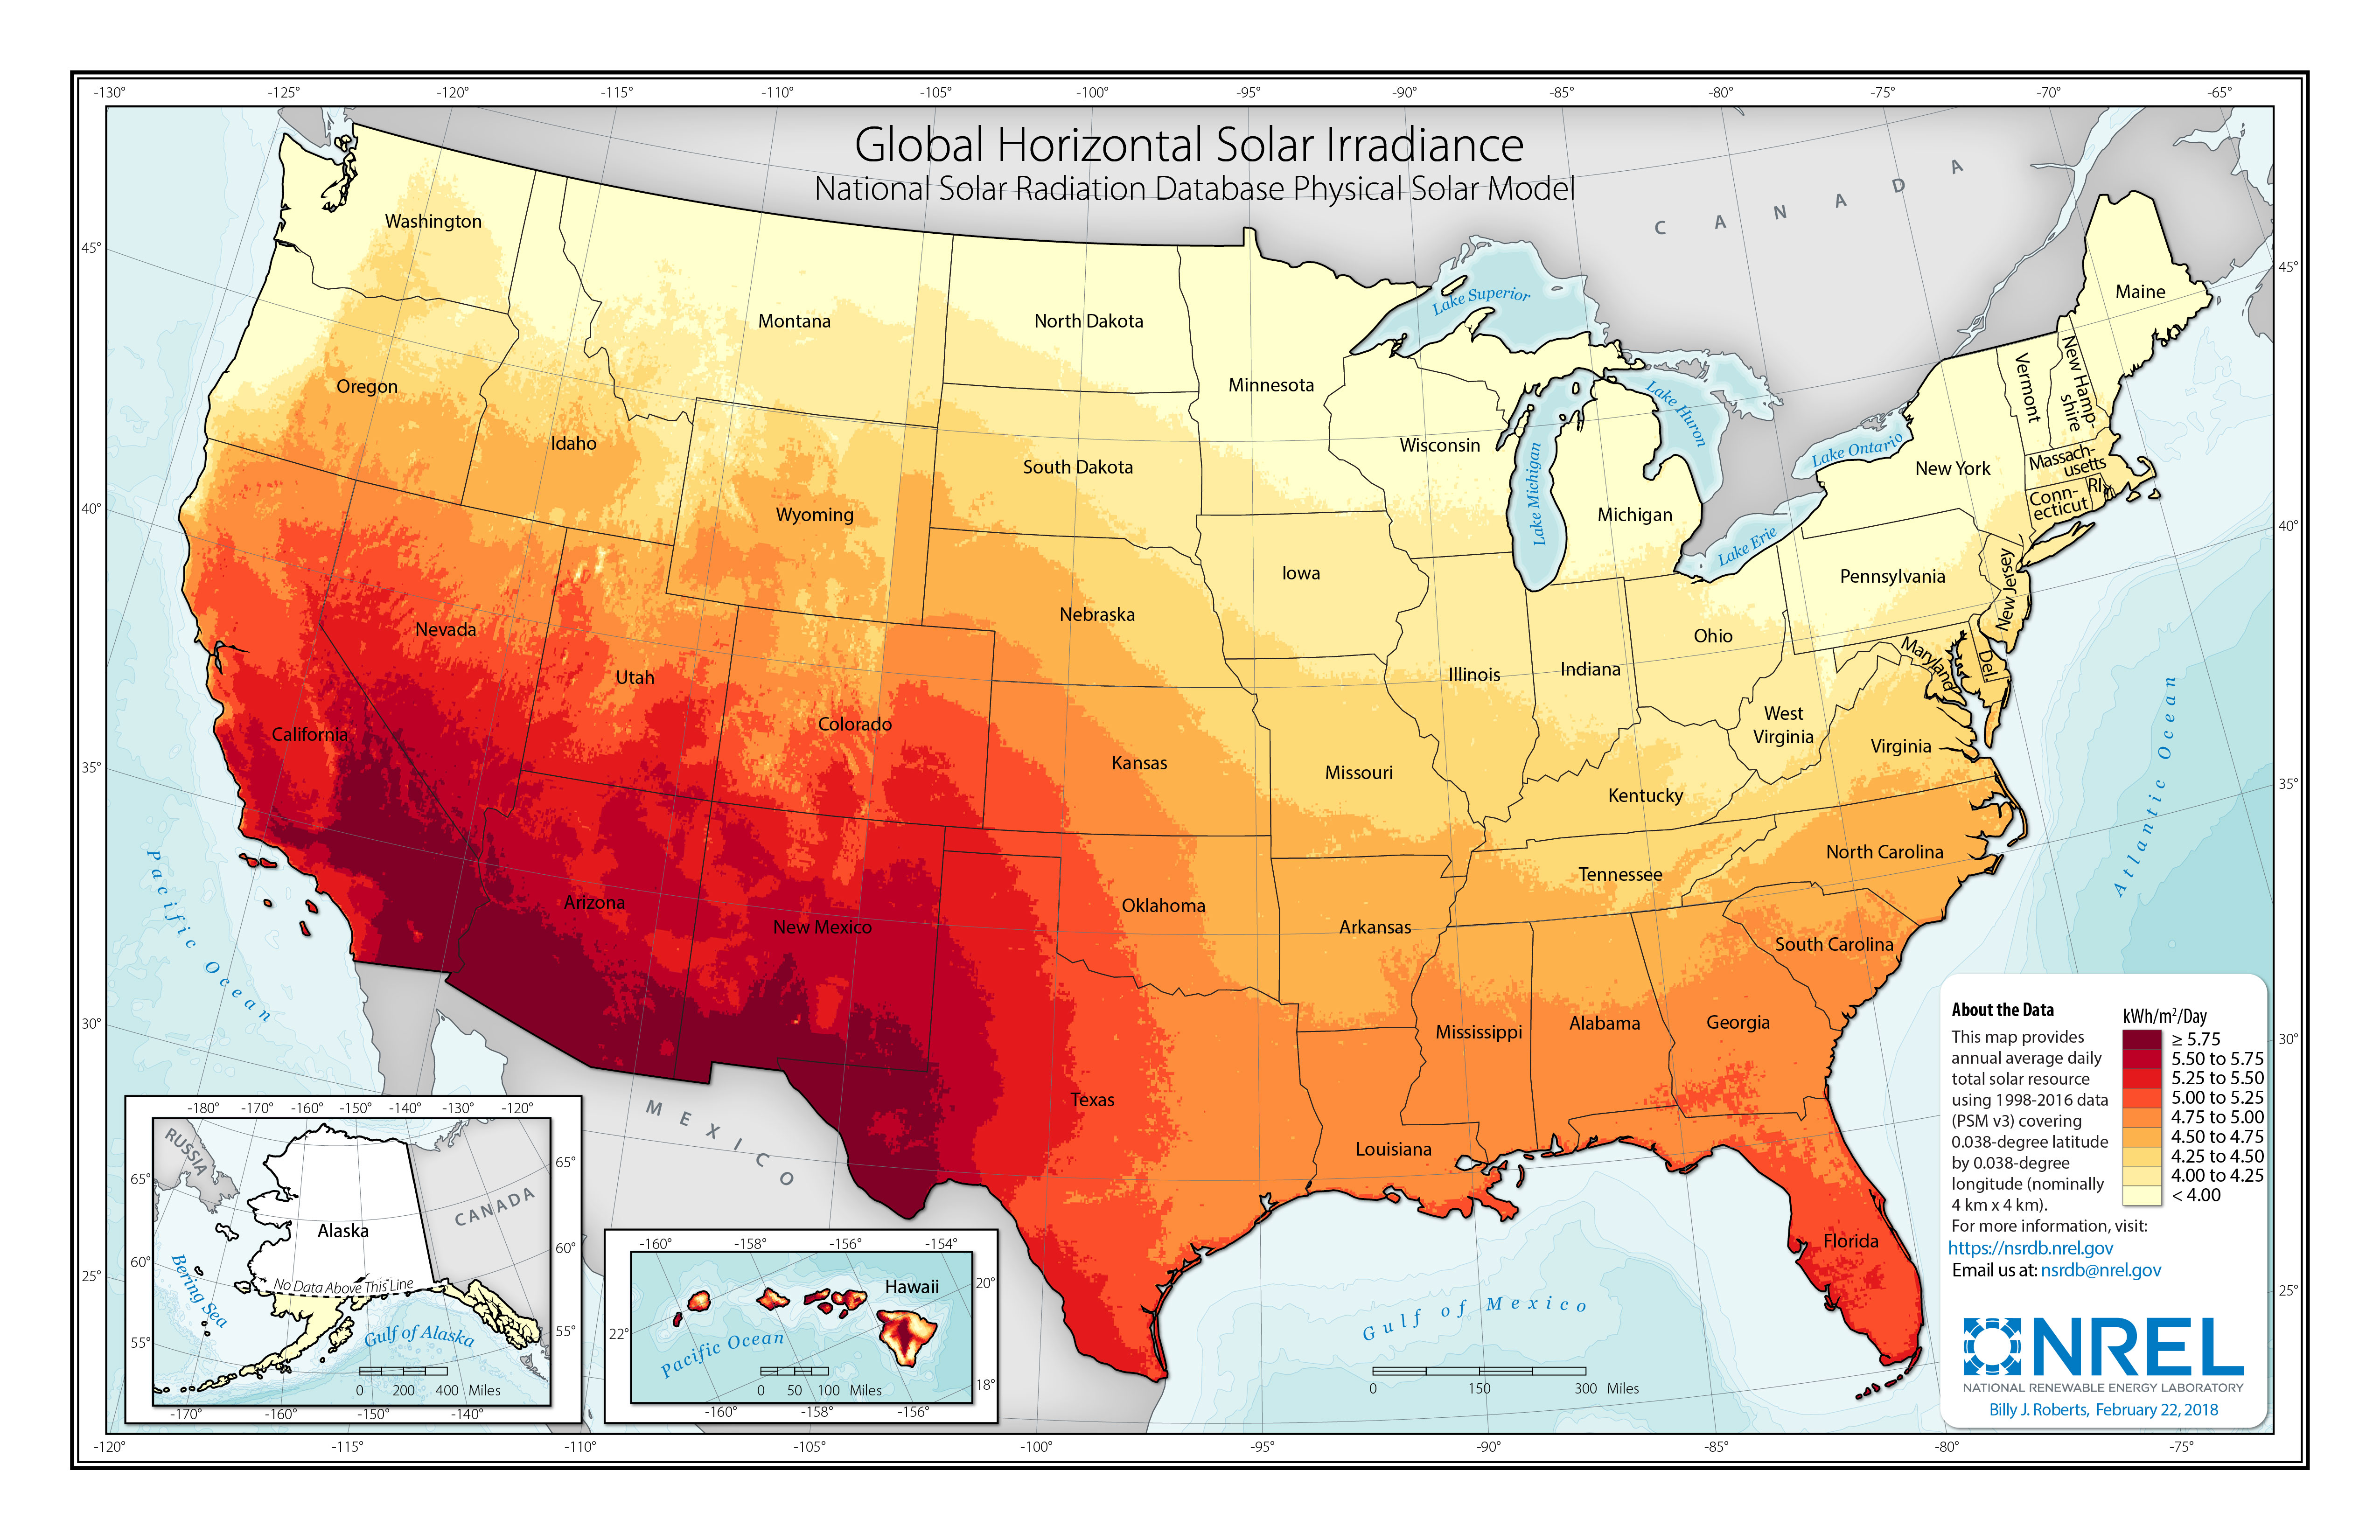
The potential for generating electricity from solar power in the United States far exceeds that of Europe. Deserts are particularly abundant with photons, and flat land lends itself to the physical area required for large-scale solar panel installations. As a result, analysts and producers expect the southwestern United States to continue to be a hotbed of solar activity. At the same time, even New Jersey’s installed solar capacity is about the same as the entire country of Spain, which indicates that solar is not restricted to desert regions. For example, Germany is a world leader in solar installations, but solar insolation per square meter in Germany is about the same as that in Alaska.
The National Renewable Energy Laboratory worked with collaborators from universities across the United States under the direction of the U.S. Department of Energy in order to visualize the average daily total solar resource for the entire country. The maps are all available as part of the U.S. State Solar Resource Maps online collection.
The map linked below shows global horizontal solar irradiance for the entire country. Individual state's maps are available through the maps collection. Use both sets of maps to answer the following questions.
Ask students to answer the following questions:
TEKS
SS.6.6B, SS.6.3C

We'd love to help answer any questions and help you get started! Drop us a line and we'll get back to you as soon as we can.
Watt Watchers of Texas
204 E. Dean Keeton Street, Austin, Texas 78712
contact@watt-watchers.com
Nos encantaría contestarle cualquier pregunta que tenga y ayudarle empezar! Envíenos un mensaje y nos pondremos en contacto con usted lo antes posible.
Watt Watchers de Texas
204 E. Dean Keeton Street, Austin, Texas 78712
contact@watt-watchers.com